Study area
The North Saskatchewan River Basin (NSRB), located in Alberta, Canada, serves as a pivotal pillar in sustaining diverse economic sectors, such as agriculture, municipalities, recreation, and hydroelectric power generation. This region's intricate connection to the origin and evolution of the Canadian Rocky Mountains, shaped by compressional tectonics that gave rise to the Mountains and Foothills, stands in stark contrast to the undisturbed subsurface Plains. This intricate geological context delineates the distribution of hydrostratigraphic units, hydraulic properties, and topography, which, in turn, define the distinctive regions of Mountains, Foothills, and Plains (Refer to Figure 3).
Project workflow
To accomplish the objective of this study, a fully distributed and physically based model is employed to simulate the entire terrestrial segment of the hydrologic cycle, allowing for a spatiotemporal evaluation of the water losses attributed to evapotranspiration and the origins that contribute to these losses. The successive stages of this project are illustrated in Figure 2.
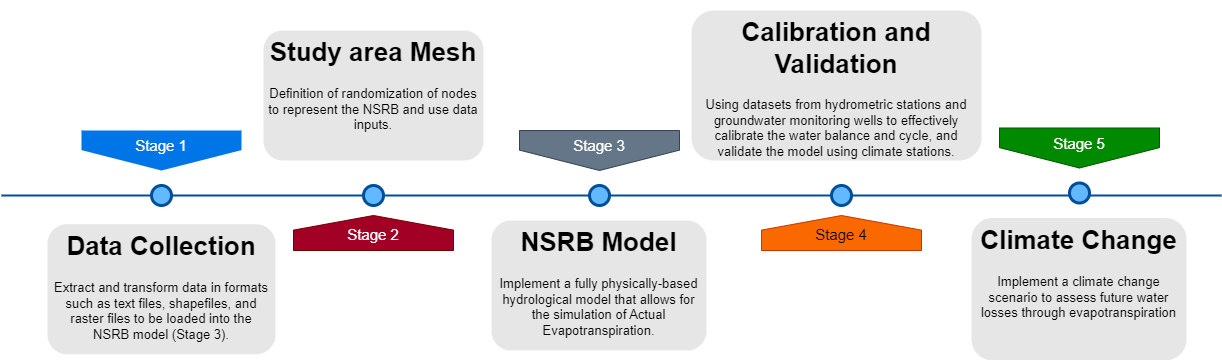
Figure 2. Research project stages
Stage 1: Data Collection
|
In order to construct and fine-tune the NSRB model, a diverse range of data types is essential. This includes meteorological, geological, hydrological, land use, soil, topographic, and hydrogeological information (see Table 1). The data collection process spans several critical components:
Climate Data: To develop a comprehensive understanding of the region's climate, data from 22 climate stations was gathered. These stations provided precipitation time series data spanning three decades, from 1983 to 2013 used to create raster files as inputs for the model. Additionally, a substantial dataset comprising information from 610 locations within the Climate Forecast System Reanalysis (CFSR) dataset was acquired. This dataset covered key climate parameters such as solar radiation (slr), wind speed (wnd), temperature (tmp), and relative humidity (rh) (Figure 3), all for the same 30-year timeframe used to calculate the Potential Evapotranspiration (PET) using Penman–Monteith equation and include the time series result as raster files in the model. 3D Model Building Data: The construction of the model necessitated hydrogeological, soil, land use, and topographic data as shapefiles and/or raster files, information that is going to be assigned to the mesh nodes in the stage 3. |
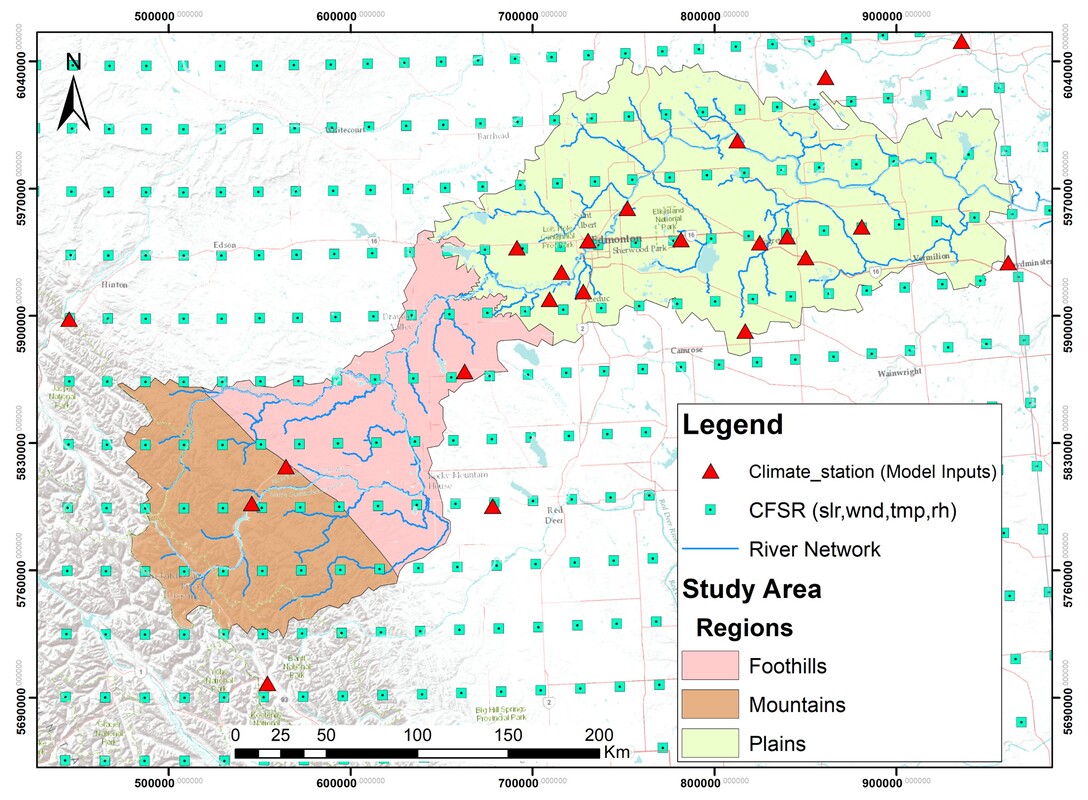
Figure 3. Climate data locations
Climate Change Scenario Data: To account for potential future scenarios, a downscale climate dataset derived from the European Earth System Model for CMIP6 was incorporated as raster files. Specifically, this project focused on the most pessimistic scenario, SSP585, projecting conditions for the far future for the years 2070 to 2099.
|
Stage2: Study Area Mesh
The definition of mesh nodes in the study area was established using the digital elevation model (DEM). It involved including more nodes in river valleys with gentler slopes to accurately represent the 3D shape of the river network, facilitating the flow of surface water. Given the significance of ET, where land use, regional characteristics, and hydraulic properties are crucial factors, a total of 8677 mesh nodes were randomly generated (Figure 4).
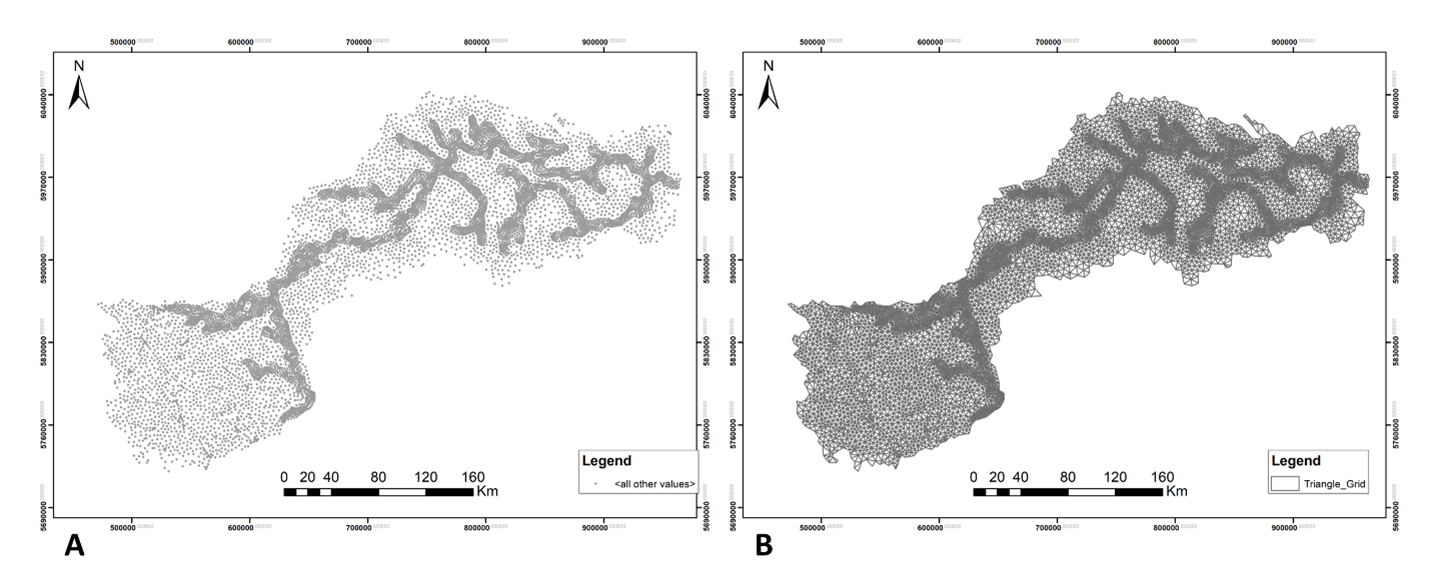
Figure 4. A) Mesh nodes, B) Triangular elements of the mesh.
Stage 3: North Saskatchewan River Basin Model
To achieve the objectives of the project the HydroGeoSphere (HGS) model was implemented which is a fully physically base model which considers all key components of the hydrologic cycle (Figure 5). For each time step, the model solves surface and subsurface flow, mass and energy transport equations simultaneously and provides complete water balance.

The total hydrologic budget can be written as:
Where: P= net precipitation (actual precipitation - interception), QS1 and QS2= the surface water inflow and outflow. QGS= the surface/subsurface water interactive flow ETS= evapotranspiration from the surface flow system ETG= the evapotranspiration from the subsurface flow system QW S= overland water withdrawal ∆SS= the surface water storage over time step ∆t QG1 and QG2= the subsurface water inflow and outflow QW G= subsurface water withdrawal ∆SG=subsurface water storage over time step ∆t AET is the sum of ETS and ETG is the ET from the subsurface flow system (subsurface evaporation + subsurface transpiration), which detailed formulas are defined and documented in the section 2.5.3 of HGS Theory Manual. |

Figure 5. Regional Hydrologic Cycle (Aquanty Inc. (2015). HydroGeoSphere Theory Manual.)
|
To achieve the objectives of the project the HGS model was implemented which is a fully physically base model which considers all key components of the hydrologic cycle (Figure 5). For each time step, the model solves surface and subsurface flow, mass and energy transport equations simultaneously and provides complete water balance.
Stage 4: Calibration and Validation
The calibration stage involves comparing the observed data from 55 groundwater monitoring wells (Groundwater Levels-GOWN) and 13 hydrometric stations (historical flow measurements) in the basin, as shown in Figure 6A, with the simulated results. To create the model, precipitation measurements from 22 climate stations were included as input data. After the calibration process, precipitation measurements from 8 different climate stations than those used as input data were used to validate the model (Figure 6B), comparing the observed data with the simulated precipitation of the node closest to each station.
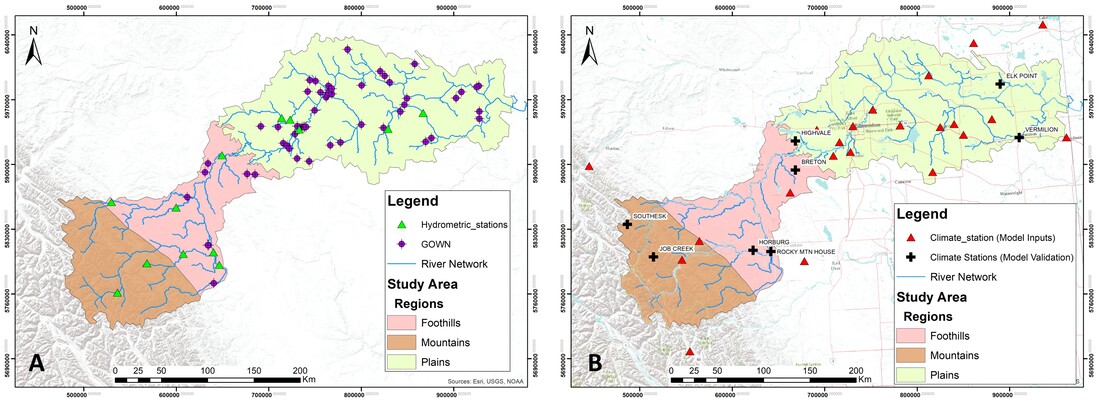
Figure 6. Location of Climate stations used for calibration (A) and validation (B) processes.
Stage 5: Climate Change
For future projections of the hydrological cycle and evapotranspiration in this study, climate data from the Coupled Model Intercomparison Project Phase 6 (CMIP6) using the European Earth System Model (EC-Earth3-veg), downscaled as presented in Khalili et al., 2023, have been incorporated. For the purposes of this project, the less optimistic climate change scenario (SSP585) was considered.
Table 1. Input data required/available for this proposed study.

