Model Validation
In this section, we assess the model's precision as outlined in the Methods section. Due to the limited ET time series data in the study area, the validation of the model results was conducted by comparing precipitation observations from eight climate stations. These stations include Job Creek and South Esk in the mountains, Horburg, Rocky Mountain House, and Brenton in the foothills, and Highvale, Elk Point, and Vermilion in the plains, as illustrated in Figure 6B. The data for the validation analysis was obtained from Castellanos-Acuna, D., & Hamann, A. (2019), and the Alberta Climate Information Service.
Two distinct statistical analyses were carried out in model validation. The initial analysis involved a correlation study, aiming to estimate the coefficient of correlation between the monthly observed precipitation values and their corresponding monthly simulated values. The outcome of this analysis demonstrated a moderate confidence level, as indicated by an R² value of 0.62 (see Figure 19A).
Two distinct statistical analyses were carried out in model validation. The initial analysis involved a correlation study, aiming to estimate the coefficient of correlation between the monthly observed precipitation values and their corresponding monthly simulated values. The outcome of this analysis demonstrated a moderate confidence level, as indicated by an R² value of 0.62 (see Figure 19A).
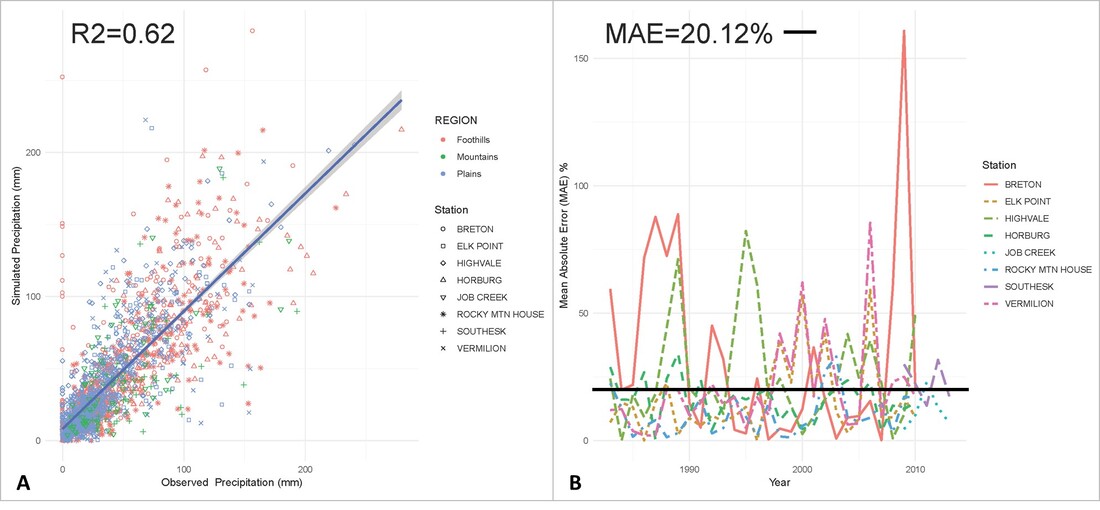
Figure 19. A. monthly observed precipitation agains monthly simulated precipitation. B. Mean Absoluted Error in percentage for the MAE over the historical period.
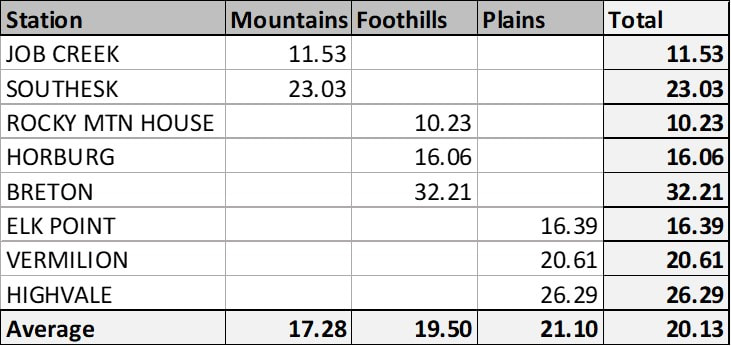
Upon further investigation, it was observed that the mean absolute error (MAE) for mean annual precipitation (MAP) exhibited variability over time. Notably, the Brenton station in the foothills region demonstrated the poorest precision during the eighties and 2009, with the highest MAE recorded at 160.8% (refer to Figure 19B). Furthermore, the average simulated MAP for this station displayed the least precision, with a MAE of 32.21%, as illustrated in Table 4.
Expanding our analysis to the entire watershed, the average MAE for MAP was calculated at 20.12%. This figure falls within an acceptable range for climate variables, indicating overall satisfactory precision across the studied region.
Expanding our analysis to the entire watershed, the average MAE for MAP was calculated at 20.12%. This figure falls within an acceptable range for climate variables, indicating overall satisfactory precision across the studied region.
Table 4. MAE (%) for MAP
Regional Analysis
Profound Evapotranspiration Shifts in Mountains
The region experiencing the highest variability and most significant changes in water loss due to ET is the mountainous area. The results for this region are illustrated in Figure 20, which encompasses Needleleaf forests, grasslands, croplands, shrublands, barren lands, snow and ice, and water. In all of these land use categories, the modeled results of climate change projections for the years 2070 to 2099 (Future period) indicate a substantial increase in annual mean ET. This increase ranges from approximately 20% in cropland to around 100% in areas with snow and ice coverage.
Similar rates of increase are evident in the future demand for water by the atmosphere, as indicated by PET. However, despite an expected precipitation increase of approximately 30%, land covers at higher elevations, such as Barren lands and areas with snow and ice coverage, are projected to experience more substantial increases, specifically 77% and 108% in future AET. Grasslands and areas with water coverage, on the other hand, are projected to increase by approximately 55%. This overall shift in the water balance indicates a trend toward greater ET relative to the water received through precipitation.
Within this region, the distribution of ET from the surface and porous media is projected to remain relatively consistent in the future. However, it is noteworthy that Grassland, Needleleaf forests, and areas with snow and ice coverage are expected to surpass historical PET averages, indicating a significant change in water loss dynamics in these specific land use categories. In addition, in both the historical and future periods, the precipitation will exceed the PET, resulting in a yearly surplus of precipitation to meet the atmospheric water demand.
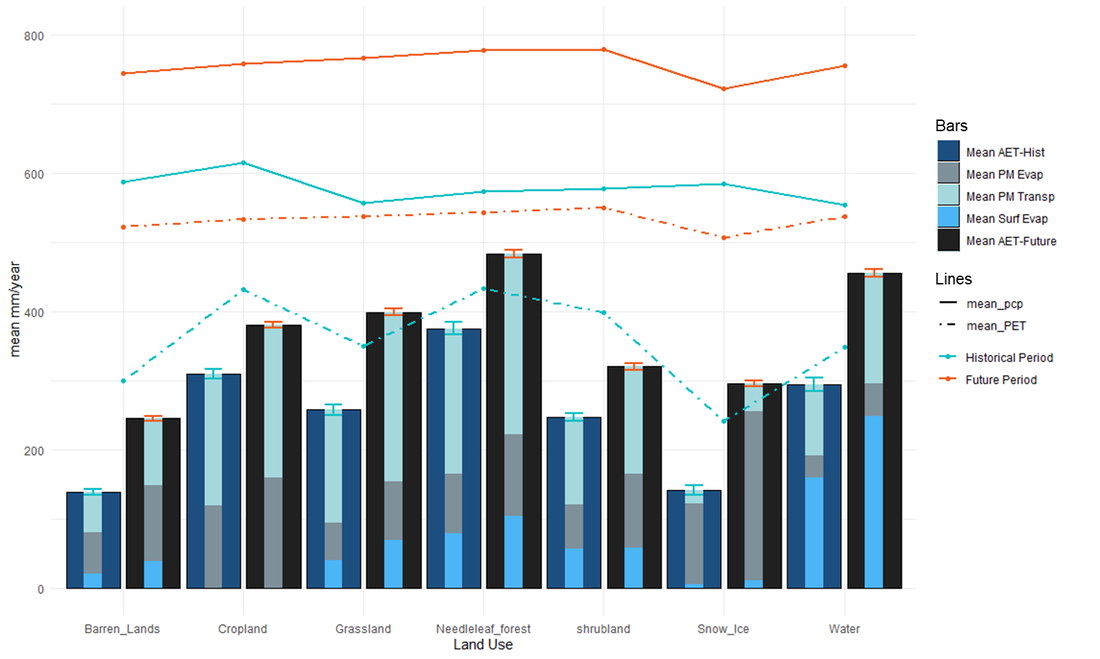
Figure 20. Means in the Mountain - Means and standards of AET per land use and modeled period. Navy blue bars represent the historical period, and black bars represent the future period. The bars inside each period indicate the proportions of Surface Evaporation (blue bars), Porous Media Evaporation (grey bars), and Porous Media Transpiration (pale blue bars) contributing to the AET. Solid lines denote precipitation means, and dashed lines represent PET means. The line colors orange and mint correspond to the future and historical periods, respectively.
The Foothills' Weather Shift: From Consistency to Change
The foothills represent the region with the highest mean AET, increasing from 467 mm/year during the historical period to 496 mm/year during the future period. Additionally, it has the highest mean precipitation, rising from 569 mm/year during the historical period to 684 mm/year during the future period.
As illustrated in Figure 21, during the historical period, the means of precipitation and PET through different land covers didn't change drastically. Precipitation in this region used to be less than PET. However, for the future period, precipitation in Grassland, Needleleaf forest, Shrubland, and Wetlands is projected to increase by around 30%, the same areas where PET will maintain similar historical mean values for the future period, thereby changing the pattern between precipitation and PET. In the rest of the land cover, both variables are expected to increase by less than 15%.
The rise in mean AET within this region remains below 10% when compared to historical averages. In areas where Grasslands, Needleleaf forest, Shrubland, and Wetland are present, the increase in AET is primarily supplied through evaporation from porous media. In the remaining land cover categories, the new amount of water evaporates more evenly distributed across the three components. Notably, the mixed forest category stands out as the land cover class that exhibits the highest water consumption through ET in this region, with values increasing from 513 mm/year to 570 mm/year. The contributions from both surface and porous media show minimal variation.
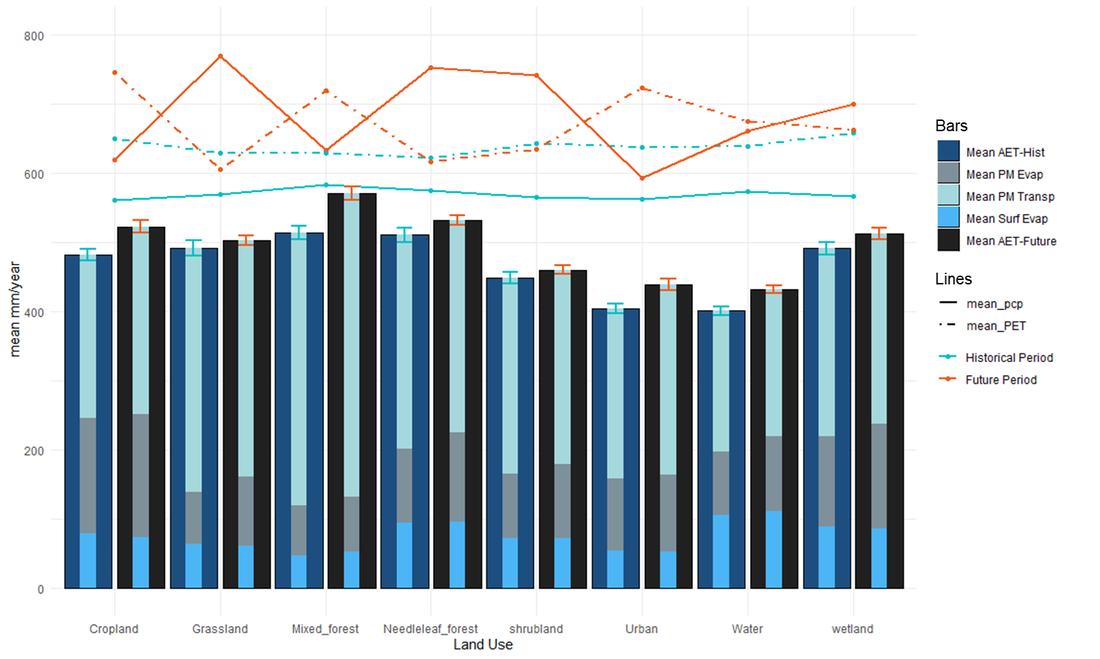
Figure 21. Means in the Foothills - Means and standards of AET per land use and modeled period. Navy blue bars represent the historical period, and black bars represent the future period. The bars inside each period indicate the proportions of Surface Evaporation (blue bars), Porous Media Evaporation (grey bars), and Porous Media Transpiration (pale blue bars) contributing to the AET. Solid lines denote precipitation means, and dashed lines represent PET means. The line colors orange and mint correspond to the future and historical periods, respectively.
Plains: From Water Shortage to Surplus
The analysis of the means reveals that the plains rank as the second region with the highest ET, while experiencing less precipitation than ET during both modeled periods while PET remains relatively steady, as shown in Figure 22. In the historical period, most land use categories in this region exhibited mean AET exceeding mean precipitation, except for cropland, urban, and wetland areas. To compensate for this water deficit, water ET was drawn from water storage in the surface and porous media. However, the results indicate that in the future period, mean precipitation will surpass mean AET.
Furthermore, in this region, the sources of water supplying AET will undergo significant changes in the future. While the amount of water transpiring from porous media remains similar to that of the historical period, the contribution from surface water evaporation diminishes. Instead, evaporation from the porous media (soils and rocks) takes on a more substantial role in meeting the demands of AET. In some areas with Needleleaf forests, the contribution from surface evaporation may be completely eliminated, thanks to an increased mean precipitation. As a result, the soil and rocks remain saturated, temporarily storing water resources to meet the demands of ET.
Furthermore, in this region, the sources of water supplying AET will undergo significant changes in the future. While the amount of water transpiring from porous media remains similar to that of the historical period, the contribution from surface water evaporation diminishes. Instead, evaporation from the porous media (soils and rocks) takes on a more substantial role in meeting the demands of AET. In some areas with Needleleaf forests, the contribution from surface evaporation may be completely eliminated, thanks to an increased mean precipitation. As a result, the soil and rocks remain saturated, temporarily storing water resources to meet the demands of ET.
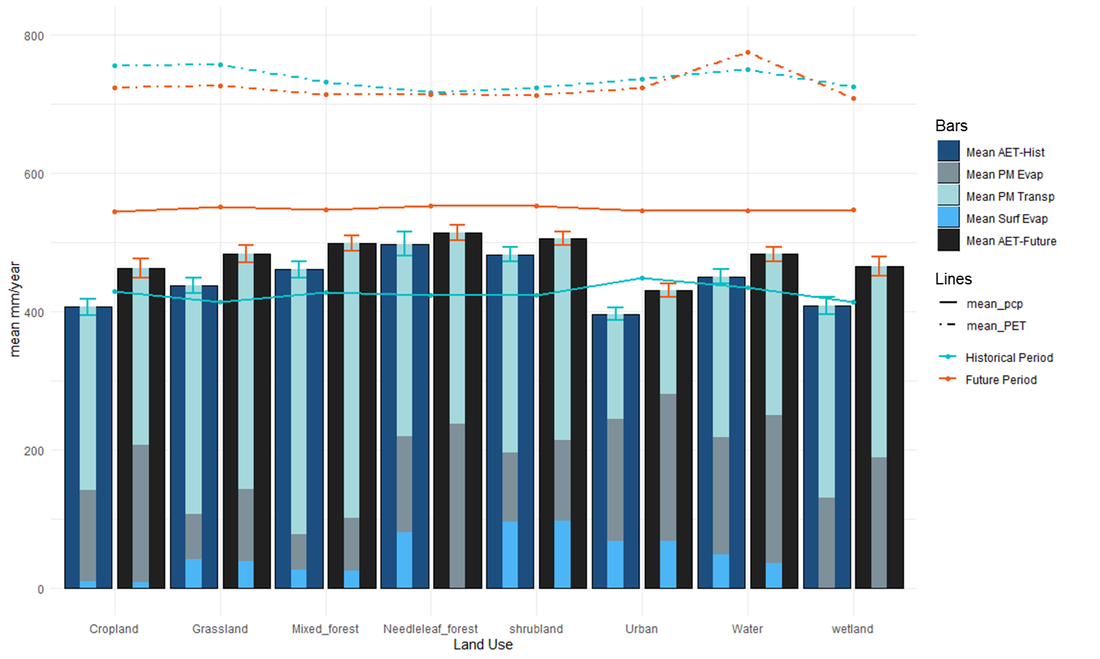
Figure 22. Means in the Plains - Means and standards of AET per land use and modeled period. Navy blue bars represent the historical period, and black bars represent the future period. The bars inside each period indicate the proportions of Surface Evaporation (blue bars), Porous Media Evaporation (grey bars), and Porous Media Transpiration (pale blue bars) contributing to the AET. Solid lines denote precipitation means, and dashed lines represent PET means. The line colors orange and mint correspond to the future and historical periods, respectively.
Conclusions
In conclusion, the research objectives of this study were to investigate the spatiotemporal variations in evapotranspiration (ET) from both porous media and surface water within the North Saskatchewan River Basin, with a central hypothesis that global warming would lead to significant changes in the proportion of ET from these sources. The specific objectives included the evaluation of water losses via ET in response to climate change across different regions of the basin and the analysis of ET patterns within different land use types.
The outcomes of our investigation have yielded valuable insights into the evolving dynamics of ET within the studied region. Across all regions and land use categories, it is evident that porous media transpiration, primarily associated with plant water uptake in the root zone, plays a central role in the AET process. In the mountainous region, it accounts for approximately 50% of the total ET, with the exception of snow and ice coverage areas, where limited vegetation reduces its contribution. In the foothills and plains, this proportion increases to approximately 60% during both the historical and future periods. Following porous media transpiration, porous media evaporation, involving the release of stored water from soil and rocks, contributes around 30% in the mountains, 25% in the foothills for both modeled periods, and 28% in the plains during the historical period, increasing to 35% in the future period. In contrast, surface evaporation makes a comparatively smaller contribution in all regions, with varying percentages.
The results of this research have shed light on the significant impacts of climate change on ET within the North Saskatchewan River Basin, particularly in the mountainous, foothill, and plain regions. In the mountainous area, our findings reveal a substantial increase in annual mean ET, with some land use categories experiencing up to a 108% rise by the end of the 21st century. Despite a projected increase in precipitation, areas at higher elevations are expected to undergo more significant increases in AET, indicating a shift towards greater water loss relative to precipitation.
In the foothills, we observed a significant increase in mean AET, as well as precipitation. The relationship between precipitation and PET changed in certain land cover categories, with PET remaining relatively stable while precipitation increased. Notably, evapotranspiration from porous media played a key role in water consumption in specific land cover categories, indicating a changing dynamic in water loss patterns.
In the plains region, mean AET exceeded mean precipitation during the historical period in most land use categories. However, the future period is expected to bring changes, with mean precipitation surpassing mean ET. This region will witness a significant shift in the sources of water supplying AET, with increased reliance on evaporation from porous media. Some areas, particularly those with Needleleaf forests, eliminate the contribution from surface water evaporation due to increased precipitation, allowing soils and rocks to temporarily store water resources to meet ET demands.
These findings support the central hypothesis that global warming is leading to changes in the proportion of ET from porous media and surface water within the North Saskatchewan River Basin.
